DEEP DIVE

Intensive Sea-Use Monitoring & Assessment

INTENSIVE SEA-USE MONITORING

For offshore-wind owners pursuing “wave energy as the mainstay, aquaculture as support” multi-use of a single sea area — unifying generation, aquaculture, security, ecology and compliance onto one map and one assessment, forming a full-cycle foundation across “site before, monitor during, assess after”.

01

CONTEXT

From “generation only” to “one sea, many outputs” — three-dimensional intensive development

Strict control of reclamation has locked down new sea-area supply; layered three-dimensional sea-use rights now assign the surface, water column and seabed of the same sea area separately; and policies for large-scale marine energy and deep-sea aquaculture advance in parallel — together pointing to “one sea, multiple uses, monitorable, assessable, compliant and traceable”. An offshore wind farm already holds a contiguous, rights-confirmed sea area, a natural carrier for “wind-plus” development: co-locating wave energy and wind-aquaculture integration upgrades the same sea from “generation only” to “three-dimensional, multi-output”, markedly raising value per unit of sea area.

Yet offshore settings commonly face six real-world challenges: off-grid power constrains monitoring and security; offshore equipment is hard and costly to maintain; layered rights and intensive-use compliance are complex; ecological carrying capacity is under pressure; illegal intrusion and poaching are hard to prevent; and the multiple uses lack coordination. The root cause is one and the same — the absence of a unified data foundation spanning “energy — production — environment — security — compliance”, rather than a set of disconnected single-point monitors.
02

ARCHITECTURE

Six monitoring domains + an intensive sea-use assessment engine

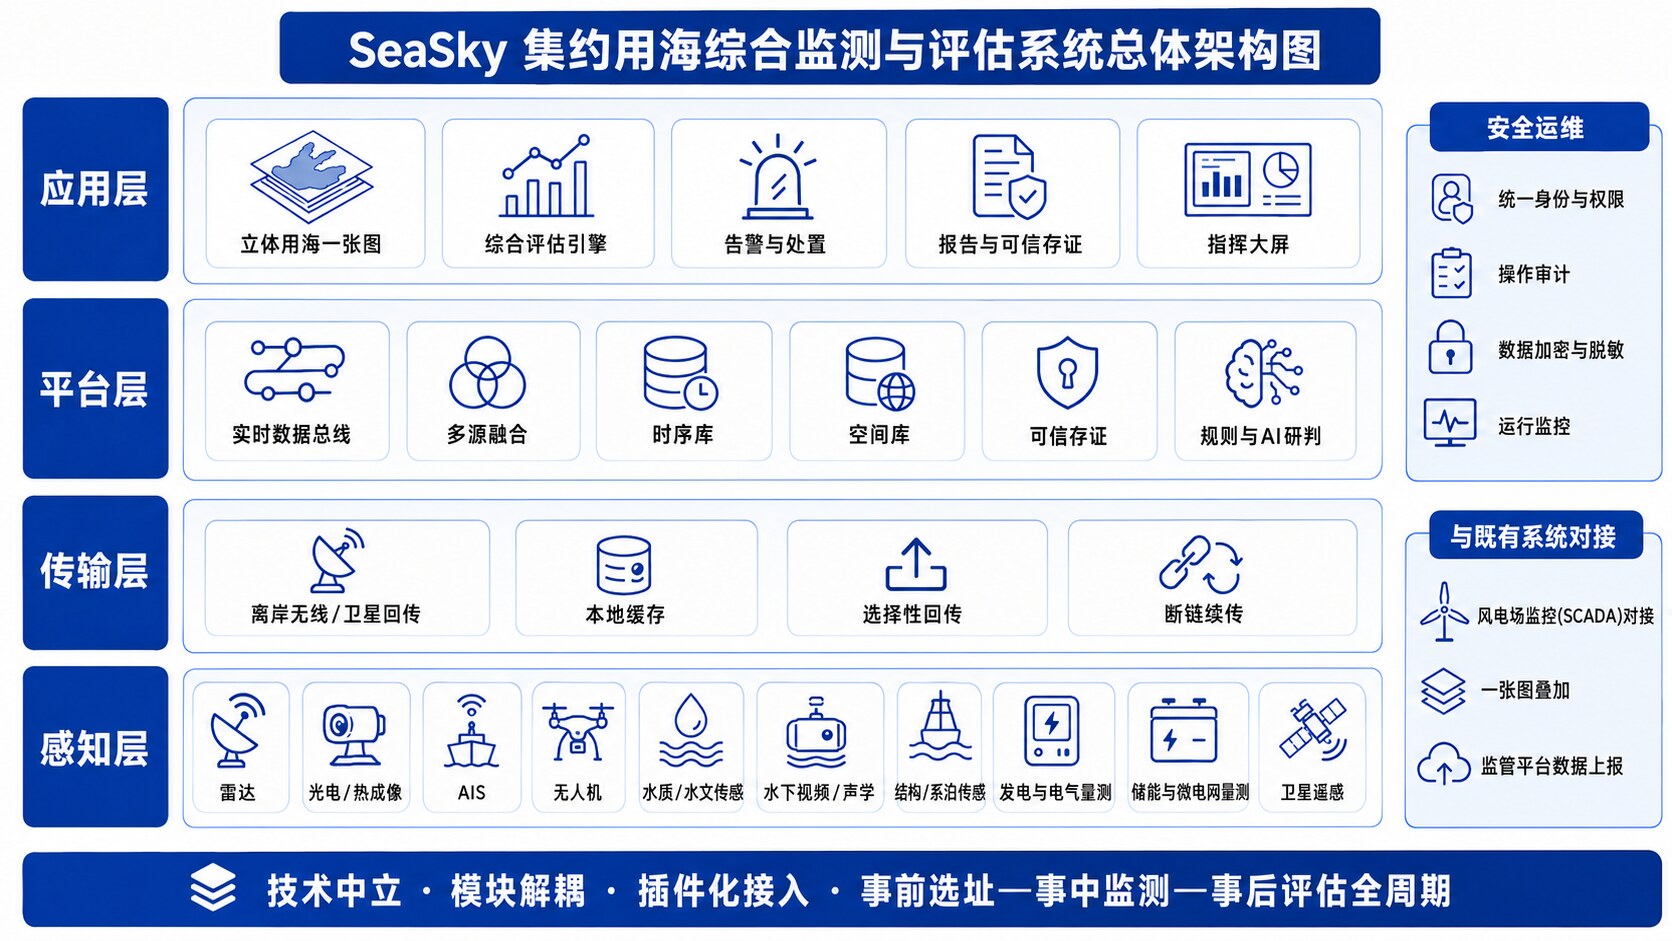
The system adopts a four-layer “sensing — transmission — platform — application” architecture, event-driven and modular, tailorable to the capabilities selected: edge-side low-power acquisition + selective backhaul + local caching suit constrained offshore communications and unattended operation; “assets” (legitimate sea-use facilities) and “targets” (objects to be identified and handled) are modeled uniformly, with a spatial database powering layered three-dimensional rendering and intensity computation; it integrates with the owner’s existing wind-farm SCADA and one-map, overlaying new uses, reusing existing data and avoiding duplicate builds. Above it, the intensive sea-use assessment engine unifies three previously siloed lenses — sea-use intensity, energy performance and ecological carrying capacity — into one view for decisions and supervision.

Overall architecture of the intensive sea-use monitoring and assessment system (schematic)
Intensive sea-use monitoring & assessment system · four-layer sensing–transmission–platform–application architecture (schematic)
A

Generation & equipment healthGeneration & Health

Captures sea-state inputs (significant wave height, energy period, wave direction, tide-inclusive water depth, wind and current speed), generation output and grid power quality; computes wave-energy flux density, conversion efficiency, the power–sea-state performance matrix, annual energy yield and capacity factor — supporting generation-performance assessment, output forecasting and green-power settlement. Wave output is highly pulsating, so flicker is the most critical grid power-quality indicator.

B

Aquaculture production & biomassAquaculture & Biomass

Monitors water-quality parameters such as dissolved oxygen, temperature, salinity, pH and ammonia nitrogen plus harmful algal blooms; combines underwater video / acoustics with intelligent recognition for biomass and count estimation, yield per unit water body and feed-conversion ratio — supporting husbandry decisions, precision feeding for cost reduction, early disease warning and output traceability.

C

Marine environment & ecologyEnvironment & Ecology

Collects water-quality, sediment, hydrodynamic and ecological indicators; performs water-quality classification, ecological indices and long-term trend / anomaly detection — aligned with national seawater-quality and marine-monitoring standards, supporting operational-phase tracking for environmental-impact assessment and post-use evaluation.

D

Facility health & structural safetyStructural Safety

Monitors structural stress-strain, six-DOF pose, acceleration and vibration, mooring-line tension and net integrity; computes mooring fatigue-damage accumulation and remaining life, key-part failure probability, biofouling-induced degradation (soft monitoring) and survival-state criteria under extreme loads — supporting predictive maintenance and proactive risk avoidance in typhoons and other extreme sea states.

E

Offshore microgrid energy flowMicrogrid Energy

Monitors each energy unit’s generation power, storage state-of-charge, bus voltage and load distribution; computes energy balance, clean-energy self-sufficiency and storage health — driving “power-adaptive scheduling” that dynamically tunes acquisition frequency and security-patrol intensity by state-of-charge, sustaining continuous power for long-term unattended off-grid platforms.

F

Maritime security (intrusion protection)Maritime Security

Fuses radar, electro-optical and thermal imaging, AIS, UAVs and intelligent video analytics for air–sea target identification, legitimate / illegitimate discrimination and geo-fence intrusion assessment; auto-alerts on poaching, intrusion and sabotage and generates a trusted evidence chain — guarding aquaculture and facility zones against theft, intrusion and damage.

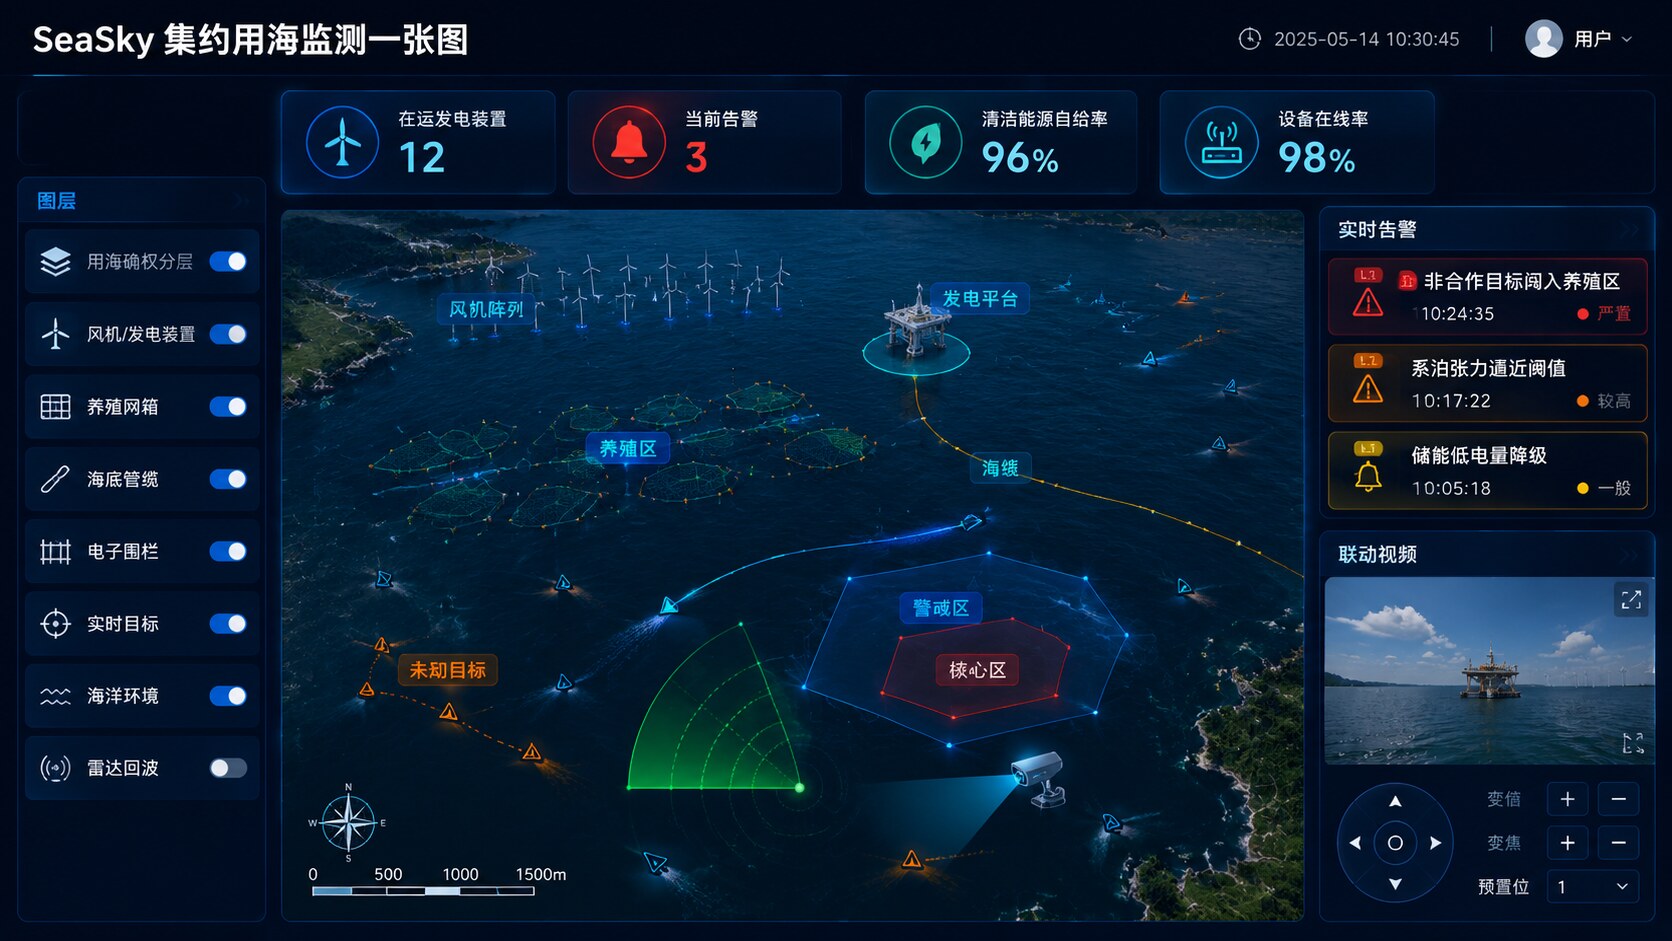
Intensive sea-use monitoring one-map (UI concept): layered sea-use rights, target situation, linked video
Three-dimensional sea-use monitoring one-map · UI concept
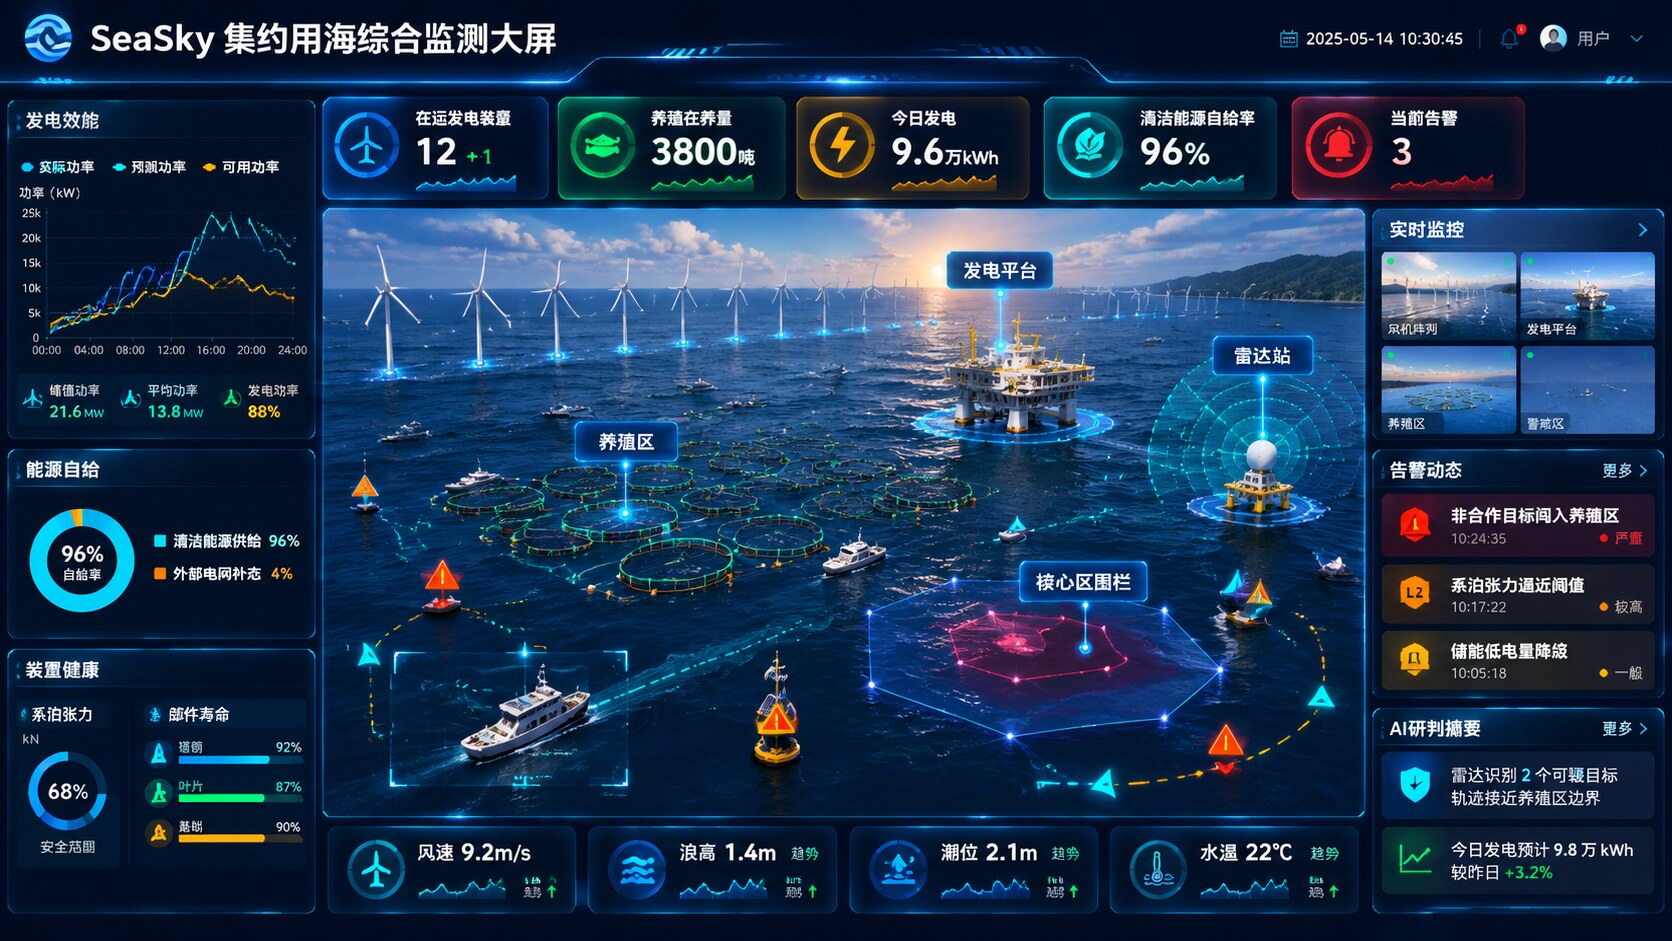
Intensive sea-use monitoring dashboard (UI concept): generation performance, energy self-sufficiency, equipment health, alert assessment
Intensive sea-use monitoring dashboard · UI concept
03

WORKFLOW

Siting — sensing — self-sufficiency — assessment — evaluation, full-cycle

  1. 1

    Resource assessment & siting (before)

    Multi-source sea-state resource assessment from numerical models, reanalysis data and buoy calibration outputs resource grade and stability, annual-yield potential and siting-compliance conclusions — de-risking pre-investment feasibility decisions.

  2. 2

    Three-dimensional sensing access

    The six monitoring domains connect on demand per the capabilities selected, with edge-side low-power acquisition + selective backhaul + local caching for constrained offshore communications and unattended operation; new data sources join as driver plug-ins without affecting existing links.

  3. 3

    Energy–monitoring–security self-sufficient loop

    Wave energy (a hybrid microgrid with PV and storage) powers monitoring and security devices, which in turn safeguard generation health, aquaculture output and intrusion prevention; the system applies power-adaptive scheduling by storage state-of-charge for long-term off-grid availability.

  4. 4

    Intelligent assessment & coordinated dispatch

    One sea-state dataset pays off three ways — generation-resource assessment, structural-safety warning and security situation assessment; in typhoons and other extremes it auto-orchestrates a “de-rate — safe shutdown — tighten mooring — security downgrade” risk-avoidance plan.

  5. 5

    Integrated assessment & trusted reports

    The engine unifies sea-use intensity (including three-dimensional reuse rate), energy performance and ecological carrying capacity, periodically producing tamper-evident assessment reports — supporting O&M and evidence internally, and certification, financing and regulatory reporting externally.

04

ADVANTAGES

Why GW-OCEAN

Energy–monitoring–security self-sufficient loop

Generation supply, monitoring assurance and intrusion prevention interlock within one energy and data loop, with power-adaptive scheduling for long-term off-grid use — an integrated capability that separately procured point products cannot deliver.

One three-dimensional map, aligned with intensive-use policy

It speaks the regulator’s language with “three-dimensional reuse rate + intensive-control indicators”, rendering surface / water-column / seabed layers together — making “intensiveness” visible, computable and provable.

A trusted data foundation as a lasting moat

Tamper-evident records (hash chain + trusted timestamps + write-once storage) run through operation, output and ecology, supporting certification, financing, traceability and regulatory reporting — hard to replicate quickly.

Full-cycle coverage, technology-neutral evolution

A closed loop from feasibility siting (before) and operational monitoring (during) to integrated assessment (after); bound to no specific generation technology or device form, with built parts scaling smoothly as sea-use scope and uses expand.

05

SCENARIO

Typhoon inbound · platform-wide coordinated risk avoidance

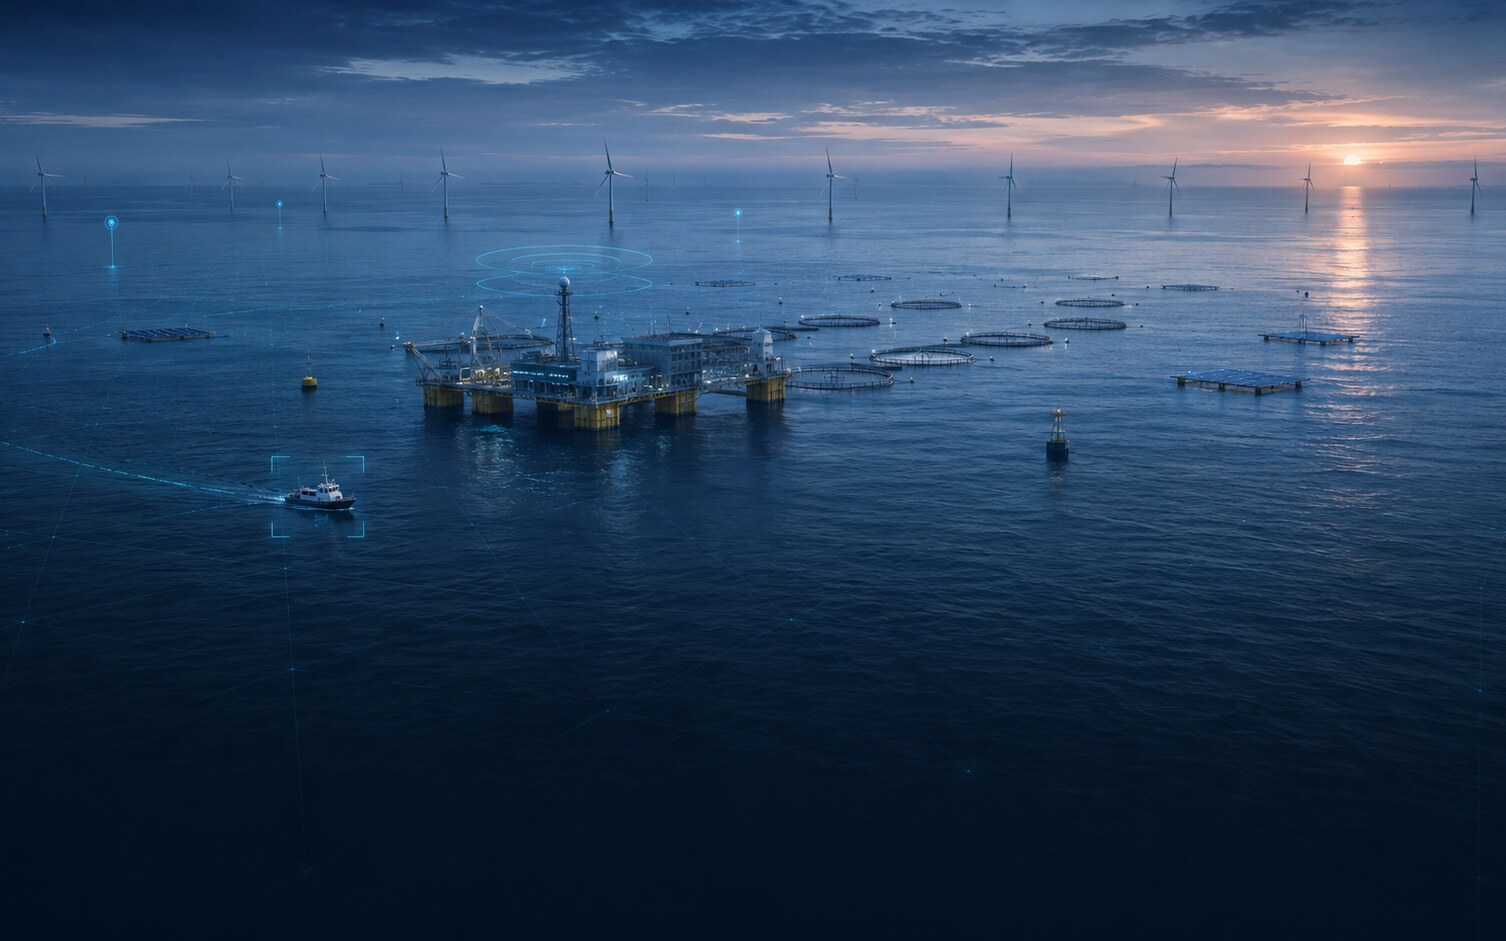
Panorama of an intensive sea-use area: offshore wind, wave energy and aquaculture co-located (illustration) Intensive Sea-Use · Coordinated Avoidance

At T-72h, sea-state monitoring detects significant wave height and energy period rising steadily; combined with external weather, the situation dashboard issues a red sea-state warning. At T-48h, the coordination engine judges from the power–sea-state matrix that the safe generation window is exceeded and auto-drafts a “de-rate → safe shutdown” work order with an estimated loss. At T-24h, facility-health monitoring tracks mooring-line tension and platform pose in real time and triggers the plan for aquaculture gear to “tighten mooring, submerge for shelter, enter survival state”, computing the safety margin.

At T-12h, microgrid monitoring confirms storage state-of-charge and, under power-adaptive scheduling, automatically lowers non-critical acquisition frequency and shrinks security patrols — poaching is unlikely in heavy weather, so the saved power prioritizes structural-safety monitoring and backhaul. At T+0, the whole process is fixed by trusted storage into a reviewable, provable “typhoon-response record” for later insurance claims and O&M review. Passive exposure becomes proactive avoidance — cutting structural and mooring damage and unplanned downtime, with minimal human intervention throughout.

  • One sea-state dataset, three payoffs: generation-resource assessment / structural-safety warning / security situation assessment
  • Power-adaptive scheduling: auto-lower acquisition frequency and shrink security patrols on low charge, prioritizing structural monitoring and backhaul
  • Hash chain + trusted timestamps throughout, supporting insurance claims and O&M review

Need a solution tailored to your sea area?

Whether marine ranching, smart fishing ports, aquaculture, or ocean observation and ecological monitoring, we’d be glad to explore it with you.